In April 2023, solar physicist Dibyendu Nandi asked his students Priyansh Jaswal and Chitradeep Saha to look at over 600 maps of the sun for clues that might help forecast the sun’s behaviour — specifically when it would be at its fiercest.
Nandi, professor of physical sciences at the Indian Institute of Science Education and Research in Calcutta, believed that hidden in those maps would be data to connect the sun’s ever-changing magnetic fields with the waxing and waning of its sunspot activity.
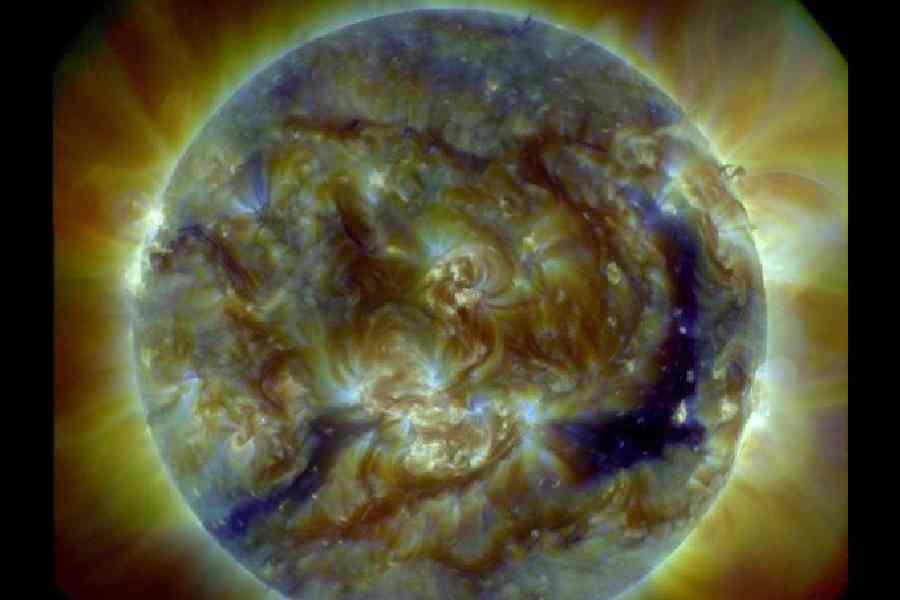
Sunspots, documented for over 400 years, are short-lived dark spots that emerge on the solar surface where the solar magnetic fields are so strong that they prevent the heat from the solar interior from reaching the surface. The sunspots appear dark because their regions are cooler, about 4,500°C, compared to the rest of the sun’s surface which is at a temperature of around 5,500°C.
The lower temperatures notwithstanding, the magnetic fields near sunspots can interact with each other and abruptly reorient themselves, triggering explosions of energy called solar flares that spew electrons, protons, and solar material — called coronal mass ejections — into space.
The electrons and protons from solar flares may approach the earth at speeds exceeding 1,000km per second and the most intense of such solar storms have
the capacity to fry the electronics on satellites orbiting the Earth or in electric power grid systems and telecommunication.

IISER scientists Dibyendu Nandi (middle), Priyansh Jaswal and Chitradeep Saha
Scientists have noted through many decades of observations that sunspot activity occurs in cycles of roughly 11 years, varying sometimes from nine to 13 years. The annual counts of sunspots range from a low 10 per year at the low-end of a cycle to, sometimes, over 200 per year at the cycle’s peak.
“Much of the focus over the decades has been on trying to forecast the intensity of the strength of the peak — to predict how many sunspots will occur at the peak,” said Nandi, head of the IISER Centre of Excellence in Space Sciences.
“But the timing is also important. The timing of a solar peak tells us when the most intense and the most frequent solar storms will occur,” he added.
Solar physicists know that the solar cycle is produced by a so-called dynamo mechanism driven by the energy from the swirling plasma flow within the sun. However, predicting the peak’s timing has been challenging with multiple efforts — many of them relying on computer simulations to predict the dance of sunspots on its surface — but no best methodology yet.
Given the intimate connection between the solar magnetic fields and the sunspot counts, the IISER team studied magnetic field maps of the sun from the period 1976 through 2023 and looked for any patterns that might emerge.
“We had roughly 600 maps — one map for every 27 days over the 50 years,” said Saha. The IISER team combined data on the strength of the solar magnetic fields from the maps with independent datasets on the changing counts of sunspots over those 50 years from multiple solar observatories worldwide.
Within three months, the three scientists had spotted a pattern — a new previously undescribed relationship between the rate of decrease in the strength of the
magnetic field and the rate of rise of the following sunspot cycle.
In 1935, Swiss astronomer Max Waldmeier had discovered that the faster the rate of rise of a sunspot cycle, the stronger its strength. In other words, stronger cycles take less time to reach their peaks. The Waldmeier effect has been used for years to
forecast the peak strength of a cycle.
Now, the relationship discovered by the IISER scientists complements the Waldmeier effect, connecting the magnetic field with sunspot activity.
Their study, published in the Monthly Notices of the Royal Astronomical Society: Letters, supports the idea that sunspots are not merely a “symptom” or a cosmetic effect of the solar dynamo process on the solar surface but themselves play a critical role in influencing the dynamo.
The IISER researchers have used their findings to predict that the ongoing solar cycle will peak in the early months of 2024. In 2019, a panel convened by the US National Oceanographic and Atmospheric Administration, the National Aeronautics and Space Administration, and the International Space Environment Services had predicted that the current solar cycle would peak in July 2025 with a maximum sunspot number of 115 that year.
But in October this year, a NOAA space weather prediction centre issued a revised forecast, saying solar activity will increase quicker and peak at a higher level than predicted in 2019. The NOAA centre said the current solar cycle will peak
between January 2024 and October 2024 with a maximum sunspot count between 137 and 173. “Our forecast appreciably coincides with the revised predictions,” Jaswal pointed out.