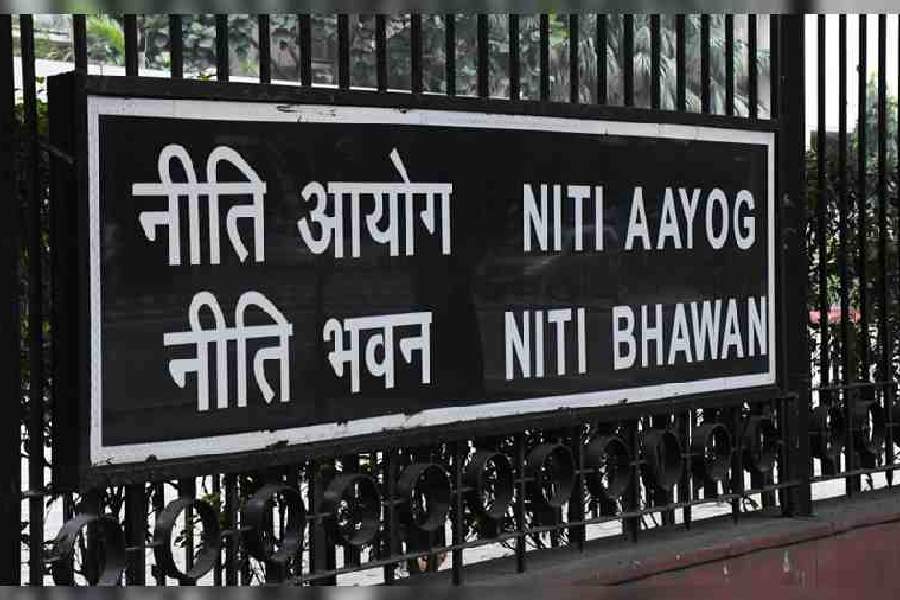
Experts have questioned the methodology and findings of the Niti Aayog report claiming that nearly 25 crore Indians had escaped poverty between 2013-14 and 2022-23.
A decrease in the poverty estimates using the Multidimensional Poverty Index (MPI) methodology does not reveal if the purchasing power of the poor has gone up in this period, economist Maitreesh Ghatak, a professor at the London School of Economics (LSE), said.
Santosh Mehrotra, a visiting professor at the University of Bath, found flaws with
the claims of the Niti Aayog based on projections of improvement for which the groundwork had been done by previous governments in health, education and public welfare.
According to the Niti Aayog’s discussion paper on “Multidimensional Poverty in India Since 2005-06”, the recent report on the National MPI was based on the NFHS (National Family Health Surveys) 4 (2015-16) and 5 (2019-21).
“Owing to lack of data for the years between 2005-06 and 2015-16 and after 2019-21 concerning the incidence of poverty levels, headcount poverty ratios for 2013-14 and 2022-23 have been estimated based on compound growth rate of the reduction in the incidence of poverty levels between 2005-06 and 2015-16 and 2015-16 and 2019-21 respectively,” said the paper.
The global MPI uses 10 indicators covering areas of health, education and standard of living. The health dimension includes nutrition and child and adolescent mortality indicators. The education dimension includes years of schooling and school attendance indicators, while the standard of living dimension includes housing, household assets, type of cooking fuel, access to sanitation, drinking water and electricity. If a person is deprived of three or more of the 10 (weighted) indicators, the global MPI identifies them as “MPI poor”.
The paper sought to debunk the traditional methodology of poverty estimation, linking it to consumption expenditure. Consumption expenditure may not accurately represent the household’s income, especially when borrowed funds contribute to consumption. It argued that household welfare depends not only on its own spending but also on state expenditures for people’s well-being. The MPI captures and reveals the outcome of economic growth and development, income and its distribution and various development initiatives of the State, it said.
The Telegraph sought Prof. Ghatak’s views on whether MPI data was reliable and comparable with the usual poverty estimation done in India by linking it to consumption expenditure.
“No, the Multidimensional Poverty Index data is not comparable with the usual measure of poverty, which is the head-count ratio, namely, the percentage of the population below a certain per capita expenditure level. The multidimensional poverty headcount ratio is the proportion of persons who are ‘multi-dimensionally poor’ in the sense of experiencing more than a threshold number of deprivations,” he wrote.
“None of these indicators capture purchasing power. The MPI can go down rapidly with improvement in amenities but with no change in per capita expenditure levels. Also, they capture quantity and not quality (do you have access to toilet, as opposed to the quality of the facility). So, while a decrease in poverty using the MPI is a good thing, it tells us little about whether over time, the purchasing power of the poor has gone
up, for which the head-count ratio provides a proper overtime comparison,” Ghatak wrote.
Mehrotra said the UPA government period witnessed increased investments in education and healthcare, among other welfare measures.
The Right To Education (RTE) Act, National Rural Health Mission and the National Food Security Act (NFSA) to provide subsidised food to over two-thirds of the people were started by the UPA government.
“The Niti Aayog annualised the improvements made on all key indicators from the period 2005-6 to 2015-16. The projected annual estimate data included the period of 2014-15 and 2015-16. So they took credit for the momentum for which the previous government was responsible,” Mehrotra said.
The report is based on the NFHS 5 that was conducted in two phases.
The report of the first phase of NHFS 5 was released in 2019 for 22 states and Union Territories. The second phase report was released in 2021. But the MPI data covered the period up to 2022-23. The average improvements registered in 22 states and UTs till 2019 were projected for the next four years and the average improvements witnessed in the remaining states in 2021 were projected for the next two years.
“Such projection is methodologically flawed. The Covid outbreak disrupted all activities. The schools were closed till 2022. Mortality indicators were impacted by Covid. So the Niti Aayog’s projections are methodologically flawed,” Mehrotra said.