The Narendra Modi government on Wednesday put out a new set of data that tried to show that economic growth during the NDA regime was far higher than that during the 10-year UPA tenure.
The announcement is being seen as an effort to head off the embarrassment sparked last August when the National Statistical Commission came up with figures that claimed the then Congress-led government under Manmohan Singh had achieved a double-digit growth rate of 10.8 per cent in 2010-11.
That double-digit figure has now been lowered to 8.5 per cent. The highest-ever growth rate since Independence was recorded at 10.2 per cent in 1988-89 when Rajiv Gandhi was Prime Minister.
The Central Statistics Office (CSO) said the average growth rate during the UPA regime’s tenure of 2005-14 was 6.7 per cent compared with the NDA growth rate of 7.3 per cent in 2015-18.
Wednesday’s announcement of the outcome of the “official” data crunching stood out for two reasons, besides the dramatic turnaround in favour of the ruling regime.
One, it was announced in the middle of key Assembly elections and in the run-up to the general election. Two, the figures were released at a media conference that was addressed not merely by the chief statistician but also by the Niti Aayog vice-chairman who is considered pro-government. A former chief statistician described the role of a body like the Niti Aayog as a “first” in the history of the CSO.
Asked whether it was a coincidence that the GDP numbers have been lowered only for the UPA period, Niti Aayog vice-chairman Rajiv Kumar said: “No, it was not a coincidence. It was a matter of hard work done by the CSO officials who had taken the pain to do all the recalibration of the economy that they have done.”
Back in August, a sub-committee headed by Sudipto Mundle, emeritus professor of the National Institute of Public Finance and Policy, had estimated that the average growth during the decade-long UPA tenure was 8 per cent compared with 7.3 per cent during the NDA regime.
The Mundle committee had triggered a controversy — and created bragging rights for the UPA — after it calculated the new growth rates for the years 1994-95 to 2013-14 on the base year of 2011-12, thereby creating a back series enabling like-to-like comparison.
The base year for national accounts was changed from 2004-05 to 2011-12 on January 30, 2015 — a little over six months after the Modi government came to power.
Economists had then expressed scepticism over the growth rates achieved by the Modi regime in the absence of a back series — a lacuna that the Mundle committee report had attempted to remove.
The latest study by the CSO has shaved off over 1 percentage point from the only year when India posted double-digit GDP growth post liberalisation and from each of the three years during which the UPA had clocked growth of over 9 per cent under the Mundle report.
Recalibrating data of past years using 2011-12 as the base year instead of 2004-05, the CSO estimated that India’s GDP grew by 8.1 per cent in 2006-07 and not 9.7 per cent as estimated by the Mundle report.
Similarly, the Mundle report's estimate of a growth rate of 9.6 per cent in 2005-06 and 10.2 per cent in 2007-08 were lowered to 7.9 per cent and 7.7 per cent, respectively.
Soon after the Mundle report was made public, the government had dismissed the estimates and the assumptions on which they were made, claiming that these were not the official estimates.
Chief Statistician Pravin Srivastava and Niti Aayog’s Kumar told a joint media conference that the variation between the two sets of numbers was due to the recalibration of data in certain sectors of the economy, including mining, quarrying and telecom.
Kumar dismissed the methodology used by the statistical commission saying that it was not the “right way” to back cast the data.
“The change in methodology, use of latest survey results, use of new, more regular and reliable data sources and improvement in coverage are the major reasons for the differences between the old series and the new series,” chief statistician Srivastava said.
Later, economist and former chief statistician Pronab Sen said: “The CSO back series is more comprehensive and complete work. However, the Mundle panel extrapolated the data to come out with the numbers.”

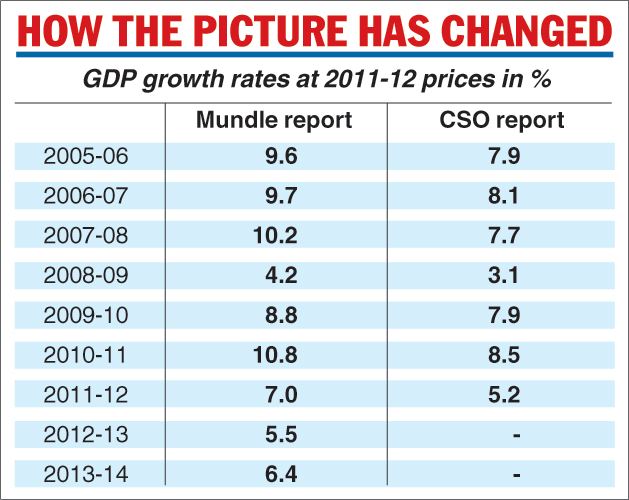
Telegraph infographic

Sen said: “I would prefer to have different methodologies being applied because the problems in each sector in terms of back-casting are different and, therefore, you cannot use the same one-size fits-all methodology… before passing a judgment on whether this is accurate or not, I would need to know which sectors have been subjected to which methodology.”
“The CSO should have come out with the back series two years back. So certainly, the timing of the release and with the NITI Aayog, a political body presiding over it for the first time in CSO history, does give it a political con
Former finance minister P. Chidambaram tweeted: “The earlier numbers were calculated by the National Statistical Commission. Has the Commission been disbanded? Now that NitiAayog has done the hatchet job, it is time to wind up the utterly worthless body. Actually, they are worse than a bad joke. The numbers are the result of a hatchet job.”
The change in the growth rates is a result in the different methodologies that the two studies have adopted.
The CSO has reverted to the traditional price splicing method which assumes that the growth rate doesn't change when there is a change in the base year.
The Mundle report believed that the old splicing method was not sufficient for the sake of comparison and instead opted for the production curve method.
The Mundle methodology attempts to take into account the fact that new economic activities are constantly emerging -- for example the telecom industry was at a nascent stage in 2003 -- while older activities tend to become extinct.